Measures of Segregation and Homicides
To measure segregation in each census year, we use the commonly employed index of dissimilarity3. The dissimilarity index captures the degree to which Black individuals are distributed across census tracts relative to Whites within an MSA. The index provides the share of the Black population that would need to move to other census tracts to be fully integrated within a city or MSA. Thus, we can capture relative separation or integration across all neighborhoods in the town or metropolitan area in our data.
To construct victimization rates between 1970 and 2010, we use mortality information from the Vital Statistics Multiple Cause of Death Files. We construct measures of victimization—homicides by race (deaths per 1,000 civilians). Homicides are reported per 100,000 individuals in each racial group. Data on local government operations, revenue, and expenditures are from the Census of Governments and the Annual Survey of Governments. These sources provide employment counts, revenues, and expenditures across various categories. We focus our analysis of government finances on total revenue, property tax revenue, and public safety expenditures (police and fire). We further supplement our analysis with school district data from the National Center for Education Statistics National School Finance Survey.
Disentangling Correlation from Causation
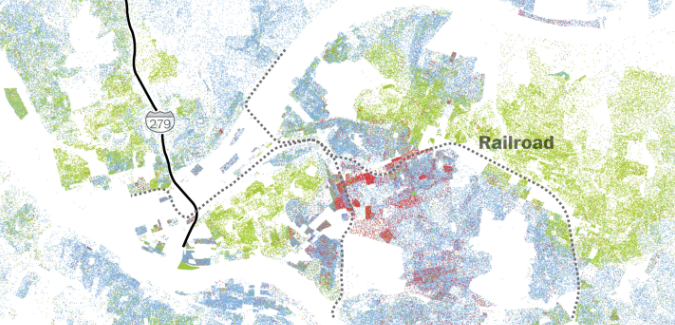
When examining the effect of segregation on homicides, confounders can pose a serious threat to internal validity because many unobserved factors (e.g., economic shocks, police pol- icy changes, neighborhood amenities) may influence both residential segregation and homicide rates, biasing estimates of a direct effect. Moreover, individual selective migration and sorting (i.e., people moving into or out of neighborhoods based on unmeasured traits) could lead to re- verse causation or omitted variable bias. To address the confounding concerns, we use a railroad division index (RDI), akin to a Herfindahl index, to exploit the configuration of railroad tracks that create subdivisions within a given location4. The configuration of railroad tracks within a city or MSA provides distinct geographical markers or boundaries that can be used to define neighborhoods. These distinct boundaries create more easily identified neighborhoods: they act as physical markers for segregated communities. Thus, we can use the RDI measure to capture exogenous variation in segregation and to establish a causal interpretation of segregation’s effects on homicides and our other outcomes. This empirical strategy is called an instrumental variables (regression) approach. The idea behind instrumental variables is to find a factor—such as the rail- road configuration—that affects segregation but is unrelated to other factors influencing homicide rates. In doing so, we can isolate the part of segregation that is “as good as random,” allowing us to estimate its causal effect rather than just a correlation. Given that the majority of railroad tracks were laid before World War I, they are not historically determined by post-migration outcomes. Figure1 plots the relationship between RDI and 1990 segregation levels. RDI is highly correlated with post-Great Migration segregation. Put another way, additional neighborhoods created by railroads are strongly correlated with the dissimilarity index (i.e., segregation).
Figure 1: Railroad Division Index and Segregation
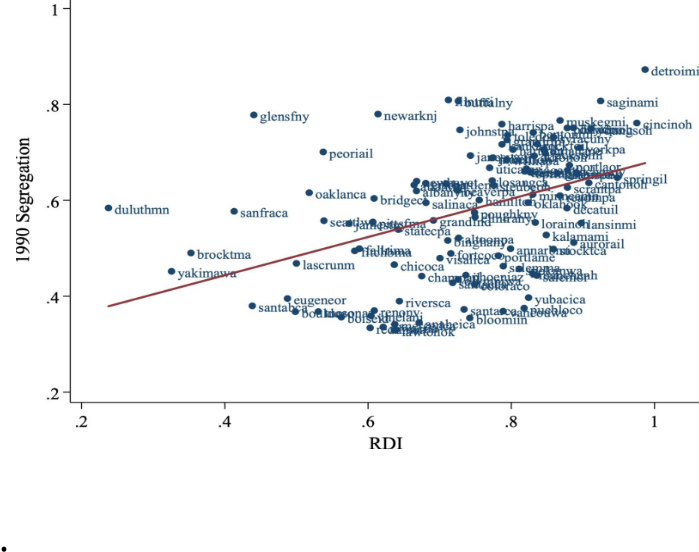
Notes: This figure plots the relationship between RDI and segregation in 1990. Segregation is measured by the index of dissimilarity.
Findings
Figure 2 shows the effect of segregation on victimization rates by race. We present our regression results by decade (1970–2010) and in standard deviations to ease interpretation. For Whites, there is no effect of segregation on homicide victimization rates: the coefficients are near zero and statistically insignificant. For non-whites, we see a relatively large and statistically significant im- pact of segregation and homicides. The coefficients remain large and statistically significant but eventually decrease after 1990. In terms of actual lives, if an MSA moved from the top quartile to the bottom quartile of segregation, 23 non-white homicides would have been averted.
Figure 2: Segregation and Homicide Victimization
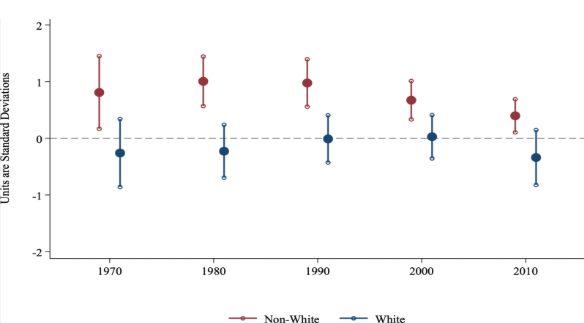
Notes: This figure plots regression estimates of the impact of segregation on homicide victimization by census year.
We also explore how government finances are influenced by segregation in Figure 3. According to our results, segregation is negatively related to general revenue and property tax revenue per capita. We highlight that the decrease in public expenditures is driven by investments in public safety (e.g., police) and schooling. School districts in segregated MSAs rely more on local property taxes and less on state revenues, thereby placing an additional burden on local municipalities. We show that school spending per pupil decreases with segregation, suggesting weaker mobility prospects in segregated cities. A one standard deviation increases in segregation decreased school expenditures by about $700 per student.
Figure 3: Segregation and Government Finances
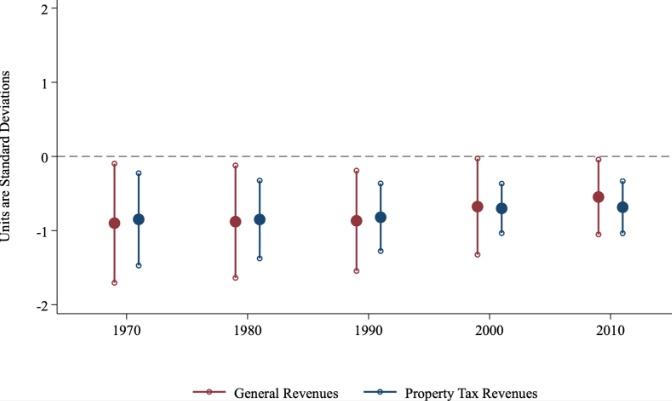
Notes: This figure plots regression estimates from a two-stage least squares analysis of the impact of segregation on local government expenditures by census year.
Implications
Overall, we find evidence that residential racial segregation leads to an increase in homicides of non-white residents. Our study illustrates the high cost of segregation and structural racism, where minorities are locked out of opportunity and receive subpar funding for public amenities, paying for these disadvantages with their lives. Therefore, targeted policies that improve socioeconomic conditions and increase opportunities for upward mobility would have long-lasting and persistent effects, decreasing non-white homicides in the long run.
References
This research brief is based on the forthcoming article "Black Lives: The High Cost of Segregation" in the American Economic Journal: Economic Policy.
- Bayer P, Charles KK, Park J. Separate and Unequal: Race and the Geography of the American Housing Market. 2021.
- Sharkey P, Marsteller A. Neighborhood inequality and violence in Chicago, 1965-2020. U Chi L Rev. 2022;89:349.
- Duncan OD, Duncan B. A methodological analysis of segregation indexes. American socio- logical review. 1955;20(2):210–217.
- Ananat EO. The wrong side (s) of the tracks: The causal effects of racial segregation on urban poverty and inequality. American Economic Journal: Applied Economics. 2011;3(2):34–66.